Showing posts with label brain imaging. Show all posts

Tuesday, August 9, 2011

British Neuroscientist Thinks the Internet Is Rewiring Our Brains

ResearchBlogging.orgA famous British neuroscientist and popular-science writer, the Baroness Susan Greenfield, who is a Professor of Synaptic Pharmacology at Lincoln College, Oxford, a member of the House of Lords, and until recently was the Director of the Royal Institution of Great Britain, has suggested that widespread Internet use might have something to do with the increasing prevalence of autism.

Here she is, quoted in an article in the Guardian:
"It could be the case that this different environment is changing the brain in an unprecedented way. It's such an important issue and I'm just putting it before people to discuss." Greenfield said there was a need for work to be done, but measuring subtle changes in the brain was extremely difficult. She cited an article in Scientific American that showed US teenagers may be losing their ability to feel empathy. "When you are social networking online and not learning how to connect face to face or how to hug, not out there rehearsing those things, then could that mean a child goes on to exhibit autistic-like behaviour?"

"I point to the increase in autism and I point to internet use. That's all. Establishing a causal relationship is very hard but there are trends out there that we must think about. I have not said that internet use causes autism and I would apologise to any family who is upset by anything I have said."

She added: "I have never, ever said that the internet is bad for the brain. But if the environment is changing, then the brain will change to adapt. All I have ever said is, let's talk about this. The internet has become the central, iconic feature of young people's lives and to say our brains will not be affected by that is to deny our evolutionary heritage."
Asked in this interview with New Scientist for any evidence supporting this hypothesis, she cites two studies: this one describing differences in brain anatomy between healthy and Internet-addicted Chinese university students, and this review (full text here) of the psychological and neurological literature on the effects of various electronic media.

She also cited this article, mentioned in this Scientific American podcast, which is a meta-analysis of 72 studies of empathy in American college students, all conducted between 1979 and 2009, and all using the same measure of empathy: the Interpersonal Reactivity Index. I will talk about that study in another post; for now, I'd like to focus on the Internet-addiction study.)

The Chinese study used diffusion tensor imaging (a type of magnetic resonance imaging that measures the movement of water molecules along a tract of fibrous tissue and uses the three-dimensional vectors, or tensors, describing the water molecule's motion to build a three-dimensional computer model of the tissue) to look for differences in gray-matter volume and white-matter structure between two groups of eighteen young people (twelve young men and six young women in each group), one consisting of people meeting diagnostic criteria for Internet addiction (using the Young Diagnostic Questionnaire for Internet addiction), and the other consisting of healthy, age- and sex-matched control subjects who said they used the Internet for less than two hours per day.
(Figure 1A, in Yuan et al., 2011 - orange blotches represent brain regions where the 18 Internet-addicted young people in this study had less gray matter than non-addicted people of the same age and sex)

They found that the Internet-addicted people had less gray matter, on average, than the non-Internet-addicted people in a few areas: the dorsolateral prefrontal cortex (i.e., the part of the prefrontal cortex that's on top and to the sides), the rostral anterior cingulate cortex (on the left side only), the orbitofrontal cortex, the cerebellum and the supplementary motor area straddling the boundary between the frontal and parietal lobes. For a few of these areas (the left anterior cingulate, the right dorsolateral prefrontal cortex, and the right supplementary motor area), the degree of atrophy correlated with how long the person had been addicted --- i.e., the longer they'd been addicted, the smaller those brain areas would be.

They also found differences in white-matter distribution between the two groups in two regions: the left posterior limb of the internal capsule and the right parahippocampal gyrus.
(Figure 2, in Yuan et al., 2011 - top series of images show major white-matter tracts in study participants' brains; image (b) gives a side view of the brain and shows an area in blue where Internet-addicted subjects are thought to have less white matter than control subjects; image (c) shows an area in orange where the Internet-addicted subjects are thought to have more white matter than controls. Bottom graph shows the relationship between their measure of white-matter density, taken at the blue area, and the duration of individual study participants' Internet addictions.)

The measure they used, fractional anisotropy, reflects the degree to which the diffusion of water is constrained by the presence of linear fibers. If there were nothing there, water molecules would diffuse outward in a sphere; the degree to which the diffusion pattern deviates from a perfect sphere, and the direction in which the most diffusion occurs, give you an idea of where the fibers are and how many of them there are.

This short, but very technical, article describes how this measure is typically used in neuroimaging studies*:


Much progress has been made in modeling more complex diffusion geometries that a single tensor fails to model, but most clinical studies still rely on simple [diffusion tensor imaging]-derived scalar measures. Some of these, such as the trace of the covariance matrix or mean diffusivity (MD) can adequately describe isotropic water diffusion, but this only occurs in the cerebrospinal fluid spaces of the brain. In the white matter, myelinated fibers resist water diffusion orthogonal to the local dominant fiber orientation, and diffusion occurs preferentially along local fiber tracts. In clinical research, white matter fiber integrity is commonly assessed by determining how strongly diffusion is directionally constrained. One common scalar measure of directional diffusion, the fractional anisotropy (FA), is computed from the diffusion tensor's eigenvalues, and quantifies the magnitude of this directional preference. Clinical studies now routinely use FA as an index of white matter integrity, sensitive to white matter deterioration in aging and neurodegenerative diseases.

Using this explanation of what fractional anisotropy values are understood to mean --- higher numbers mean more diffusion occurring in the same direction, which is taken to mean that fibers running in that direction are numerous and thick; lower numbers imply fewer and/or thinner fibers --- you can see that the researchers are saying they think their Internet-addicted subjects have less white matter (lower FA value) than their non-addicted subjects in the parahippocampal gyrus, and also more white matter (higher FA value) in the left posterior limb of the internal capsule.

The researchers believe that these changes are a result of the Internet addiction, although they can't totally rule out the possibility that they existed before the onset of addiction, and may actually have been part of the reason those young people were susceptible to addiction in the first place. In favor of their brain-changes-as-effect-of-Internet-addiction model, they cite the positive correlations they found between several of the changes they found (decreased gray matter in the left anterior cingulate, right dorsolateral prefrontal cortex, and right supplementary motor area, along with increased white matter in the left posterior limb of the internal capsule) and duration of Internet addiction. But not all of the changes showed such a correlation --- less than half, to be exact.

When you take into account brain lateralization, you come up with eleven areas that differed between groups: four of the five regions showing loss of gray matter were affected on both sides, for a total of eight affected areas, plus one more (the left anterior cingulate) and the two regions showing white-matter changes (both confined to one side of the brain). That gives you only four out of eleven affected regions where the change showed any relationship to how long the person had been addicted; if the relation to time was meaningful, you'd expect it to show up more consistently. As is, it leaves open the possibility that whatever correlations were observed are just statistical noise.

Does extensive Internet use physically change the brain? It's certainly possible, given what we know about neuroplasticity, but this study doesn't shed a whole lot of light on it. Its design makes it impossible to know whether the brain differences observed between Internet-addicted and non-addicted students were effects or potential causes of Internet addiction.

Even granting that possibility (that extensive Internet use can, over time, remodel an Internet user's brain), though, it's still very, very unlikely that there's any connection between widespread Internet use and increasing prevalence of autism. The timing is wrong, for one thing --- most autism diagnoses are given in early childhood, and a lot of parents begin to ask questions and look into it when their child is an infant or toddler. Given the text-based nature of the Internet, it is highly unlikely that pre-literate children are doing a lot of web surfing on their own.

For more about this weirdness, see Neuroskeptic, Jon Brock, Dorothy Bishop, Neuroskeptic again, and this hilarious website riffing on Greenfield's gnomic comment "I point to the increase in autism and I point to the Internet. That's all."

*The article also criticizes the measure as being too vague, and not a very good predictor of actual fiber density and location. It describes an alternative measure that the authors consider more accurate.

Yuan, K., Qin, W., Wang, G., Zeng, F., Zhao, L., Yang, X., Liu, P., Liu, J., Sun, J., von Deneen, K., Gong, Q., Liu, Y., & Tian, J. (2011). Microstructure Abnormalities in Adolescents with Internet Addiction Disorder PLoS ONE, 6 (6) DOI: 10.1371/journal.pone.0020708

Sunday, January 2, 2011

Gender on the Brain: Cordelia Fine Exposes "Neurosexism"

I was given Cordelia Fine's new book, Delusions of Gender, as a Christmas present, and I just finished reading it a couple days ago*.

It's very easy and fun to read, despite going into a lot of technical detail about the design of various studies (although she manages to write about those details in wonderfully clear, simple prose --- I *try* to do that on this blog, but I think her book is better-written, and easier to understand, than many of my researchy posts) and trying to tease out the separate strands of a very complicated knot of biology, psychology, culture that lies underneath the surface of what we understand gender to be.

She spends a lot of time discussing a topic that's also been on my mind a lot recently: fetal testosterone. She takes a much broader view of this literature than I do, because I am focusing exclusively on those studies that I consider relevant to the "extreme male brain" theory of autism, while she's addressing the whole idea that a "male brain" and a "female brain" even exist, much less that they differ as radically as most people writing popular (and academic) books on brain sex seem to think.

She peppers her book with quotations from such works as Louann Brizendine's The Female Brain (if you have time, read Mark Liberman's series of posts on Language Log debunking this book; they're hilarious and eye-opening), Leonard Sax's Why Gender Matters, John Gray's however-many-there-are-now Mars and Venus books, Allan and Barbara Pease's** Why Men Don't Listen and Women Can't Read Maps, and various books authored or co-authored by Michael Gurian of the Gurian Institute: Leadership and the Sexes, It's a Baby Girl!, and What Could He Be Thinking?

As an additional bit of context, she also quotes liberally from sources a hundred years old or more, laying out their nearly-identical visions of the masculine and feminine mind; the only difference is in what kind of pseudoscientific technobabble is used to justify the idea of separate spheres for men and women: in the old books, it is woman's physical frailty, nervous sensitivity and smaller brain that fit her for a purely domestic life, while in the new books, it is her relatively larger corpus callosum, her greater verbal fluency and emotional sensitivity, that fit her for the caring professions or for full-time wife-and-motherhood.

The book is divided into three parts, the first and last of which (called "'Half-Changed World', Half-Changed Minds" and "Recycling Gender") deal with psychological research on the effects of sexism and gender stereotyping on women's choices, behavior and performance on various tests, and with how children learn to sort themselves into gender categories, starting at very young ages.

Those parts of the book fill in the background for the middle part, "Neurosexism," which discusses research into hormonally-driven "hard-wiring" of gendered interests, behaviors and aptitudes. (It's in this part of the book that she tackles the prenatal-testosterone literature). While she does offer some critique on methodological grounds, her biggest beef is with popularizers who extrapolate universal truths from ambiguous results derived from very small, restricted samples of people.

An example:
[W]hen I decided to follow up [Louann] Brizendine's claim that the female brain is wired to empathize, it nonetheless proved to be an exercise that turned up surprise after surprise. I tracked down every neuroscience study cited by Brizendine as evidence for feminine superiority in mind reading. (No, really, no need to thank me. I do this sort of thing for pleasure). There were many such references, over just a few pages of text, creating the impression that it is no mere opinion, but scientifically established fact, that the female brain is wired for empathy in a way that the male brain is not. Yet fact-checking revealed the deployment of some rather misleading practices. For example, let's work our way through the middle of page 162 to the top of page 164 in her book. We kick off with a study of psychotherapists, which found that therapists develop a good rapport with their clients by mirroring their actions. Casually, Brizendine notes, "All of the therapists who showed these responses happened to be women." For some reason, she fails to mention that this is because only female therapists, selected from phone directories, happened to be recruited for the study.
...
A little later, readers are told that "brain-imaging studies show that the mere act of observing or imagining another person in a particular emotional state can automatically activate similar brain patterns in the observer --- and females are especially good at this sort of mirroring." Cited as support for this feminine superiority in emotional mirroring is a 2004 neuroimaging study by cognitive neuroscientist Tania Singer and colleagues, who compared brain activation when someone was either receiving a painful electric shock to the hand or was aware that a loved one was receiving the same painful electric shock to the hand. Singer and colleagues found that some brain regions were activated both by being shocked and watching someone else be shocked. If you think I'm going to be nitpicky about what any sex differences in activation in this study mean, you're wrong. Actually, the problem of interpretation is rather more basic. Only women were scanned.

Even when there aren't gross factual errors in the reporting of the research, Fine's inclusion of social- and developmental-psychology perspectives on gender --- how children learn it, how children and adults learn to change their behaviors, and their understanding of themselves, to fit into it --- makes it clear that whatever gendered differences do turn up on brain scans, they are as likely to be the effects of gender socialization as they are to be the underlying physiological cause of gender.

So, if we're not "hard-wired" by means of prenatal and pubertal hormone surges into immutable, characteristic and complementary "male" and "female" selves, what are we? Are we just blank slates, onto which society can write whatever it likes? Is there no such thing as human nature at all?

That's the alternative vision most commonly invoked in these debates: if you don't accept the idea that gender is hard-wired, you must be an environmental determinist who doesn't believe people are born with anything at all in their heads.

Luckily for us, this isn't a binary, and we don't have to choose between nature and nurture.

Here's Fine again, this time from the Epilogue of her book:
The fluidity of the self and the mind is impressive and is in continual cahoots with the environment. When social psychologists discover, for example, that mere words (like competition), everyday objects (like briefcases and boardroom tables), people, or even scenery can trigger particular motives in us, or that similar role models can seep into our most private ambitions, it makes sense to start questioning the direction of causality between gender difference and gender inequality. We are justified in wondering whether, as gender scholar Michael Kimmel suggests, "gender difference is a product of gender inequality, and not the other way around."

Nor is gender inequality just a part of our minds --- it is also an inextricable part of our biology. We tend to think of the chain of command passing from genes, to hormones, to brains, to environment. (As biologist Robert Sapolsky describes this common misconception, "DNA is the commander, the epicenter from which biology emanates. Nobody tells a gene what to do; it's always the other way around.") Yet most developmental scientists will tell you that one-way arrows of causality are just so last century. The circuits of the brain are quite literally a product of your physical, social, and cultural environment, as well as your behavior and thoughts. What we experience and do creates neural activity that can alter the brain, either directly or through changes in gene expression. This neuroplasticity means that, as [neuropsychologist Anelis] Kaiser puts it, the social phenomenon of gender "comes into the brain" and "becomes part of our cerebral biology."

As for hormones that act on the brain, if you cuddle a baby, get a promotion, see billboard after billboard of near-naked women, or hear a gender stereotype that places one sex at a higher status than the other, don't expect your hormonal state to remain impervious. It won't. "Even how we behave or what we think about can affect the levels of our sex hormones," point out Gene Worship authors Gisela Kaplan and Lesley Rogers. This continuous interplay between the biological and the social means that, as Anne Fausto-Sterling has put it, "components of our political, social, and moral struggles become, quite literally, embodied, incorporated into our very physiological being."

And so, when researchers look for sex differences in the brain or the mind, they are hunting a moving target. Both are in continuous interaction with the social context. Some researchers have even started to investigate how the brain, or hormones, respond differently while doing stereotyped tasks, depending on whether gender stereotypes are made salient. And gender differences in the mind can shift from moment to moment: for example, as stereotype threat is created or dispersed, or self-identity changes. But also, our actions and attitudes change the very cultural patterns that interact with the minds of others to coproduce their actions and attitudes that, in turn, become part of the cultural milieu: in short, "culture and psyche make each other up." When a woman persists with a high-level math course or runs as a presidential candidate, or a father leaves work early to pick up the children from school, they are altering, little by little, the implicit patterns of the minds around them. As society slowly changes, so too do the differences between male and female selves, abilities, emotions, values, interests, hormones, and brains --- because each is inextricably intimate with the social context in which it develops and functions.
...
Our minds, society, and neurosexism create difference. Together, they wire gender. But the wiring is soft, not hard. It is flexible, malleable, and changeable. And, if we only believe this, it will continue to unravel.

This closing statement encapsulates what I like so much about this book; it brings feminism, sociology, and a more accurate, more nuanced understanding of human biology together to give us a broader view of what gender is --- or at least how many different things, over a person's whole lifetime, go into creating gender.

For some other reviews of this book, see Neuroskeptic*** and Echidne of the Snakes (Part 1, Part 2, Part 3).

*I was also given Rebecca M. Jordan-Young's Brain Storm: The Flaws in the Science of Sex Differences, which covers similar ground --- both books poke and prod at the conventional wisdom that sex hormones shape "male" and "female" brains before birth, and that masculine and feminine behaviors, interests and life paths are the inevitable outcomes of these two different types of brain. I haven't finished reading Brain Storm yet, but I will probably also review it here when I do.

**Another of their books, not cited in Fine's book, refers in its title to a particularly stubborn gender stereotype that drives many feminists --- particularly sex-positive feminists --- absolutely batty: Why Men Want Sex and Women Need Love. As if no woman has ever been horny, or no man ever wanted to be loved!

***Who is cited as a source twice, and quoted once, in this book!

Wednesday, September 15, 2010

Through a (Brain) Scanner, Darkly

EXECUTIVE SUMMARY: In the August 11 issue of the Journal of Neuroscience, Christine Ecker and her colleagues at the Institute of Psychiatry at King's College in London describe a new tool they've developed for finding differences between autistic and non-autistic brains that go beyond "x brain structure is bigger/smaller in autistic people"; their method takes into account overall patterns of gray matter structure and organization. Their tool not only identifies these subtle, pervasive differences, it also "learns" them, using them to classify individual (computer models of) brains as autistic or not-autistic. The tool works quite well for that kind of classification, doing significantly better than chance on almost all its individual components, and reaching 65 to 85 percent accuracy as a whole. It can also distinguish between autistic brains and some other kind of non-neurotypical brain, in this case ADHD.
___________________________________

(Still image from the TV show "Dollhouse")

ResearchBlogging.org Apart from this brief mention on Amanda's blog, I hadn't read anything at the time about the new multidimensional brain scan described last month in the Journal of Neuroscience. I was intrigued, because one thing that's been awfully elusive to autism researchers is a consistent, reproducible biological marker that's specific to autism.

There've been some hints of neuroanatomical differences between autistic and non-autistic people in previous studies, but those differences --- in, say, the size and activity of the amygdala, the size and shape of the hippocampus, the size of the cerebellar vermis, the distribution of gray matter and white matter, the density of certain cell types within the cerebellum, the thickness of the cerebral cortex, or even in the overall size of the brain --- don't always show up when researchers look for them, nor do they always show up in every member of the (very small, carefully selected and usually quite homogeneous) group of autistic people being studied.

The authors of the recent study --- Christine Ecker, Andre Marquand, Janaina MourĂ£o-Miranda, Patrick Johnston, Eileen M. Daly, Michael J. Brammer, Stefanos Maltezos, Clodagh M. Murphy, Dene Robertson, Steven C. Williams and Declan G. M. Murphy --- suspect that there might be a broader, more pervasive pattern of altered brain structure that underlies all the different, highly variable, changes to individual structures within the brain that are sometimes seen in autism:
[R]eports of region-specific differences in ASD are highly variable [for review, see Toal et al. (2005) and Amaral et al. (2008)]. Such variable findings may simply be explained by confounds such as clinical heterogeneity between studies, or analytical techniques. Alternatively, variability in findings may indicate that differences in brain anatomy in ASD are relatively subtle and spatially distributed, and are difficult to detect using mass-univariate (i.e., voxelwise) approaches. Last, given the multiple etiology of ASD, it is likely that its neuroanatomy is not confined to a single morphological parameter but affects multiple cortical features.
To try to find out what kinds of subtle, structural differences might characterize the brains of autistic adults, the researchers scanned the brains of twenty autistic men*, twenty men without any psychiatric, neurological or developmental disorders, and nineteen men without autism but with ADHD (to provide a non-autism, but also non-neurotypical, control group to try and isolate neuroanatomical variations particular to the autism group), used the MRI data to create three-dimensional computer maps of each subject's brain, and then fed the values of five different measurements taken at each vertex of the computer model (which is made of tiny triangular facets meant to approximate the brain's curved surfaces) into a statistical-analysis algorithm called a Support Vector Machine, which Neuroskeptic describes much better than I could in this post.

The five things they measured at each vertex of their virtual mock-brains are as follows: average convexity/concavity of the cortical surface (i.e., the distance between the cortical surface at a given vertex and where the cortical surface would be if the brain were smooth); cortical thickness; mean (radial) curvature (i.e., the radius of the circle that could be drawn underneath the curve of the cortical surface); metric distortion or Jacobian, which is the ratio of the areas of the triangular facets making up the cortical surface and the gray/white matter interface; and the pial area, which is the average area of the triangular facets touching each vertex.

Since some of these things are very hard to visualize, here's a diagram:
Figure 1, in Ecker et al. (2010)

Overall, this five-parameter model works pretty well at predicting who is autistic** and who isn't, though I was surprised to see how much its accuracy differed from one side of the brain to the other. On all measures, there's a huge gap --- a gap of 20 percentage points or more, in all but one instance --- between the two brain hemispheres in terms of a given measure's accuracy (i.e., its ability to sort all subjects into the correct category), sensitivity (ability to correctly identify autistic subjects --- i.e., having a high number of true positives and a low number of false negatives) and specificity (ability to correctly identify non-autistic subjects --- i.e., having a high number of true negatives and a low number of false positives).

For whatever reason, the left hemisphere much more than the right showed consistent neuroanatomical differences between autistic and non-autistic subjects.

Here's a classification plot showing the two categories as determined by applying the five-variable classifier to the left hemisphere:
Here, all but two autistic subjects are placed into the positive (i.e., autistic) category, and all but four control subjects are correctly placed into the negative category.

Contrast that with the right-brain results ---

--- where you see a lot more crossover between categories, plus several subjects straddling the border line. It is also only in the left hemisphere that any correlation is observed between how far to the right of the dividing line a person is and their ADI scores in the social and communication domains.

Some parameters also performed better than others: cortical thickness had the highest accuracy levels of any parameter (90% in the left hemisphere!), followed by metric distortion.

Finally, in the left hemisphere the model also succeeded in distinguishing ADHD subjects from autistic ones. (In the right hemisphere, it placed about equal numbers of ADHD subjects in each category). That's important because it shows that the model is actually picking up on characteristics of autistic brains, instead of just registering all deviance from "normal."

So, what *ARE* these characteristics of autistic brains? Well, they vary by region --- not only in terms of which parameter is relevant, but also in terms of how autistic people differ from neurotypicals on a given parameter.

For instance, if you look at this map of how the autistic subjects' brains differed from the controls in terms of cortical thickness, you can see that some parts of the brain (mostly on the temporal lobe) tend to have a thicker layer of gray matter in autistic people, while in other areas (mostly on the frontal and parietal lobes), the cortex tends to be thinner in autistic people.

Figure 4 (A), in Ecker et al. (2010); red areas represent more gray matter in relation to average non-autistic brain, blue areas represent less gray matter.

Some of the areas that showed up as having an "excess" of gray matter surprised me, as differential activity in those areas (fusiform gyrus, superior temporal sulcus) had previously been theorized to underlie autistic "deficits" in making sense of faces.


Besides these differences in amount of gray matter, there were also some strong differences in gray matter geometry: first, the autistic subjects showed greater sulcal depth in two regions --- the intraparietal sulcus and the superior frontal cortex --- and second, the inferior parietal lobes and certain regions in the right frontal lobe --- the right supramarginal gyrus, postcentral gyrus, and orbitofrontal cortex --- along with the precuneus, showed different patterns of cortical folding.

For example, here's the right intraparietal sulcus:

From Figure 5 (B), in Ecker et al. (2010)

The blue line represents the cortical surface for the average control subject; the red line represents the average autistic subject's cortex. You can see that the sulcus goes down deeper in the autistic subjects, and also that the gyri on either side are a bit steeper.

I would like to point out, again, that it's not necessarily any single variation at any one region of the brain that this statistical analysis has tied to autism, though --- it's a pattern of gray-matter distribution. It's also a pattern that's so far only been observed in a tiny, rather homogeneous sample of autistic men --- much larger, broader-based studies of this classifier need to be done to see if the same patterns hold up for all of the people currently lumped together under the category "autistic," or whether separate neuroanatomical phenotypes will define autistic subtypes.

I would also like to see future studies done using different diagnostic tools to define the autistic group --- if the goal of this research is to establish a biomarker for autism diagnosis so that we can finally be done with frustratingly ambiguous diagnosing-from-behavior, it will hardly do to have the biomarker be dependent on one of the older behavioral diagnostic tools for its template!

*According to this table showing demographic data on the autistic and control (but not the ADHD) subjects, the autistic subjects were mostly young, and some middle-aged, men (the average age (33) was much closer to the age of the youngest person (20) than it was to that of the oldest person (69)) and had a very wide range of IQ scores as measured by the Weschler Abbreviated Scale of Intelligence. The standard deviation, for full-scale IQ and for verbal and performance IQ, was around 20 points for the autistic group, and scores ranged from 76 (just one point over the cutoff point the authors chose to designate intellectual disability, which is a full-scale IQ of 75) to 141, with verbal IQs ranging from 78 to 133 and performance IQs from 77 to 138. These subjects, I'd like to point out in the spirit of adding to Michelle Dawson's recent post on functioning levels, were all defined as having Asperger's or high-functioning autism.

**Autistic subjects were determined to be such using either the ADI-R (for fifteen subjects), the ADOS (for five) or both (two).


Ecker C, Marquand A, MourĂ£o-Miranda J, Johnston P, Daly EM, Brammer MJ, Maltezos S, Murphy CM, Robertson D, Williams SC, & Murphy DG (2010). Describing the brain in autism in five dimensions--magnetic resonance imaging-assisted diagnosis of autism spectrum disorder using a multiparameter classification approach. The Journal of neuroscience : the official journal of the Society for Neuroscience, 30 (32), 10612-23 PMID: 20702694

Monday, May 24, 2010

Autism, Alexithymia and Empathy

EXECUTIVE SUMMARY: Earlier this year, a group of psychologists and neuroscientists published a paper showing a relationship between alexithymia (difficulty identifying and expressing feelings) and lower levels of activity in a part of the brain that previous studies have linked with the capacity to feel empathy for another person. They did not find any such relationship between autism and decreased activity in this region of the brain, although autistic people do experience alexithymia at much higher rates than the general population. This paper builds on a similar article from 2008, by most of the same authors, that sought to measure autistic people's levels of emotional self-awareness by, first, measuring their self-reported levels of alexithymia and empathy, and then having them undergo fMRI scanning while looking at, and reporting their response to, strongly emotionally charged images. That study's results were somewhat ambiguous, since there wasn't a group of strongly alexithymic subjects who were not autistic, so, while levels of alexithymia were shown to correlate with reduced brain activity in both the autistic and control groups, there were also some differences between the autistic group's results and those of the control group that might result from multiple factors. The later study seems to suggest that much of this difference arises from the autistic group's higher overall scores on measures of alexithymia.
_____________________________________

ResearchBlogging.org Emotions --- whether they're one's own or another person's --- are widely believed to be terra incognita for autistic people. Many of us believe this about ourselves; Data and Spock are the "Star Trek" characters in whom autistic fans tend to see themselves.

To a degree, this is true of us more than it is true of non-autistic people. We have much higher rates of alexithymia --- the inability to put emotional states into words --- than the general population. Just because we can't talk about what we're feeling doesn't mean we don't understand it, though; it just means we have a much harder time explaining it to other people. (Also, even when we're not alexithymic, it's fairly common for autistic people to have all sorts of problems with language in general). It's also made even harder by the fact that the kinds of things that we feel tend to be a lot different from the kinds of things non-autistic people are likely to feel in any given situation. We are usually very much aware that our experiences are different from theirs, even if we might not have much of an idea how they might differ.

I've already discussed the role of shared experience, or lack thereof, in the "empathy gap" between autistic and non-autistic people. (Other people have, too). What I'm going to do in this post is discuss two recent fMRI studies comparing brain activity during tasks designed to elicit empathic emotional responses between groups of autistic and non-autistic study participants.

Both of these studies start from the assumption that autistic people really are objectively impaired at picking up on emotional cues, and seek to identify neural and psychological factors specific to autistic people that might explain this.

The first study --- Silani et al., 2008 (full text here) --- involved two groups of fifteen participants (thirteen men and two women), one made up of people with diagnosed autism-spectrum conditions and the other of age-, sex- and IQ-matched controls. The researchers had both groups fill out several questionnaires --- the Toronto Alexithymia Scale (TAS-20), the Bermond-Vorst Alexithymia Questionnaire (BVAQ-B) and the Interpersonal Reactivity Index (IRI) --- and then look at images on a screen and evaluate something about them on a sliding scale (either their own emotional response to the image, or the balance of light and dark colors within the image) while having their brain activity measured by fMRI.

In their Introduction, the authors propose a three-tiered model of emotional experience: the first layer is the emotion itself, and the changes in mental and physical state associated with it (e.g., racing heart, sweating, agitation, excitement, shivers, lethargy or tears); the second layer is the awareness of what is happening to you physically; and the third is awareness of the emotional reasons for what is happening to you physically. They cite previous fMRI studies (and reviews) implicating the amygdala and orbitofrontal cortex in first-order emotional experience, and the anterior insula and anterior cingulate cortex in what they call "interoceptive awareness" --- awareness of bodily changes, including those brought on by emotions.


They didn't find very much different between the autistic and control subjects' patterns of brain activity, and the major correlations they established --- between low scores on the alexithymia indices, high scores on the empathy index, and higher levels of activity in the mid-anterior insula during the emotion-rating part of the experiment --- held equally true for both groups of subjects. The autistic participants also showed a correlation between those test scores and increased activity in the left amygdala; no such pattern occurred, even to a diminished extent, among the non-autistic ones. Another area of the brain --- a circuit consisting of the medial prefrontal cortex, anterior cingulate cortex, precuneus, frontal inferior orbital cortex, temporal poles and cerebellum, collectively called the "mentalizing network" --- also lit up during this task, and showed lower overall activation for the autistic group than for the control group, although its activity was not correlated to either measure of alexithymia, which surprised the researchers.


So, while this study helped shed some light on why some people --- including many autistic people --- have such poor insight into their own states of mind (to say nothing of others'), it raised almost as many questions as it answered. To what extent are the differences in empathizing between autistic and non-autistic people attributable to autistic people's greater chances of being alexithymic? Why are autistic people so much more likely to be alexithymic? Why didn't alexithymia correspond to lower activity levels in the mentalizing network while the subjects were supposed to be mentalizing?


The second study --- by Bird et al., 2010 (full text here) --- was designed to try to make the relationship between autism, alexithymia, cognitive empathy and emotional empathy a bit clearer. It involved two groups of eighteen men: one whose members all had diagnoses of autism or Asperger syndrome, and most (13 of the 18) of whom also met Autism Diagnostic Observational Schedule (ADOS-G) criteria for either autism or autism-spectrum disorder; and another group of neurotypical men matched with the experimental subjects for age, IQ and degree of alexithymia. Within both groups, participants ranged from low scorers to very high scorers on the Toronto Alexithymia Scale (TAS-20): within the autistic group, scores ranged from 37 to 80, with a standard deviation of 11.8 and an average score of 57.2; within the control group, the average score was 50.3, the standard deviation 14.5, and the range 27 to 72. A TAS-20 score of 60 indicates alexithymia; scores between 52 and 60 are considered borderline.


Here is the authors' own assessment of what they're trying to find out:

To determine whether the often-reported empathy deficit in autism spectrum conditions is due to the alexithymia comorbidity within this group or to the presence of an autism spectrum condition, we sought to investigate: (i) whether empathic brain responses were correlated with degree of alexithymia in autism spectrum condition and control groups; (ii) whether the relationship between degree of alexithymia and empathic brain response varied as a function of autism spectrum condition diagnosis; and (iii) whether the autism spectrum condition and control groups exhibited differential levels of empathic brain activity after accounting for levels of alexithymia.

The experiment in the second study was actually kind of disturbing: they tried to measure empathy directly --- rather than relying on self-reported answers to questionnaires --- by having the participants bring someone they cared about into the lab with them, and then tracking their brain activity as that person received mild electric shocks on the back of their right hand.


I hadn't thought researchers were allowed to cause pain in experiments anymore. This worries me.


Whether or not I am personally creeped out by this experiment, though, it did furnish some pretty solid evidence that it's alexithymia, and not autism per se, that dampens people's capacity to feel other people's emotions as if they were their own.

Among members of both groups, seeing their partners in pain (before one member of each pair was to be shocked, a symbol would appear on the screen in front of them telling them who the unlucky person was and how intense the shock would be, so the researchers had a way to compare their subjects' reaction to different levels of vicarious distress) triggered activity in the left anterior insula, which intensified in proportion to the severity of the shock their loved one was getting. That activity --- the "empathic brain response" the researchers are talking about --- also correlated negatively with the subjects' scores on the alexithymia questionnaire: the more alexithymic the men in either group were, the less intense their brain activity in response to their loved ones' pain was.

Besides shoring up the hypothesis that alexithymia (or whatever its absence is called --- lexithymia?) has something to do with empathy, this newer study also throws up some roadblocks on the free-association superhighway pop psychology has built between autism (particularly Asperger syndrome) and lack of empathy.

After correcting for degree of alexithymia, all significant between-group differences in brain activity vanished. The researchers also looked for a correlation between degree of alexithymia and severity of autistic symptoms as measured by the ADOS, and found none:
A final analysis was conducted to investigate a possible concern with respect to the current study: that alexithymia scores are a proxy for symptom severity in autism spectrum conditions. If true, the present findings could be explained by hypothesizing that controlling for degree of alexithymia before testing for group differences in empathy causes all variance due to autism spectrum condition symptom severity to be removed. This would result in a spurious null result and a false conclusion of there being no empathy deficit in autism spectrum conditions after controlling for alexithymia. Such a possibility is made plausible by the inclusion of participants who, despite having received a clinical diagnosis of autism or Asperger's syndrome, do not meet ADOS-G cut-off [criteria] in the sample of individuals with autism spectrum conditions. These individuals may raise the mean empathic brain response in the autism spectrum condition group and mask any differences in empathy due to diagnosis of an autism spectrum condition (if alexithymia scores are a proxy for autism spectrum condition symptom severity the corollary of this would also be true; highly alexithymic participants in the control group may also have high levels of autism spectrum condition symptoms). To guard against the possibility that any null effects observed in the data could be caused by overly inclusive diagnostic classification, or statistical covariance between ADOS scores and alexithymia scores, the ADOS scores were regressed against empathy-related brain data and alexithymia scores as measured by the TAS. ADOS scores were unrelated to all these measures (all correlations P > 0.4). Inspection of scatterplots (Supplementary Figs. 1-3) showing the relationship between the ADOS and empathy-related brain data, TAS and BVAQ scores, reveals that it is not the case that participants with low ADOS scores are clustered at the extremes of the distributions of any measure. In addition, the relationship between alexithymia (TAS scores) and empathic brain response was found in both the autism spectrum condition and the control groups, who were matched for degree of alexithymia. Thus, it is unlikely that any of the observed effects are an artefact of inappropriate diagnosis, or a statistical artefact due to high covariance between autism spectrum condition symptom severity and degree of alexithymia.
So, autism and alexithymia are distinct, unrelated, though overlapping things, and only one of them --- alexithymia --- seems to have any bearing on affective empathy. (Cognitive empathy might be a different story; questionnaire data from both studies show significant differences between autistic and control subjects on subscales specific to cognitive empathy/Theory of Mind, like the perspective-taking subscale on the Interpersonal Reactivity Index and the cognitive component of the Bermond-Vorst Alexithymia Questionnaire. There's still plenty to criticize about this measure of empathy, too, particularly its one-sidedness, but that's not the focus of this post).

Bird, G., Silani, G., Brindley, R., White, S., Frith, U., & Singer, T. (2010). Empathic brain responses in insula are modulated by levels of alexithymia but not autism. Brain, 133 (5), 1515-1525 DOI: 10.1093/brain/awq060

Silani G, Bird G, Brindley R, Singer T, Frith C, & Frith U (2008). Levels of emotional awareness and autism: an fMRI study. Social neuroscience, 3 (2), 97-112 PMID: 18633852

Monday, November 30, 2009

The Fusiform Face Area: Not a Site of Autistic Difference After All?

ResearchBlogging.org In a comment on one of my old posts, Amanda pointed me to this intriguing review article (full text here) questioning whether the widely-reported impairment of face processing in autistic people actually exists.

The authors review three different bodies of evidence having to do with face processing: behavioral studies (i.e., comparing autistic and neurotypical people's accuracy in identifying/distinguishing individual faces, or classifying facial expressions, from videos or photos; faces might be those of strangers, or of people known to the subjects, and might also be turned upside down or partially covered up in some experiments), electrical and magnetic evoked potential studies (i.e., doing EEGs or MEGs of people as they look at images of faces), and brain-imaging studies (doing fMRIs or PET scans of people as they look at images of faces).
The behavioral literature on how autistic people perceive faces shows that, though we are not necessarily any worse at identifying faces, or facial expressions*, we tend to go about it using different methods.

We look at different parts of the face: some studies --- like Joseph and Tanaka, 2003 (full text here); and Klin et al., 2002 --- find that we spend a lot more time looking at the lower parts of faces, particularly the mouth, while others --- among them van der Geest et al., 2002 (full text here); Dalton et al., 2005 (full text here); Lahaie et al., 2006 (full text here); Bar-Haim et al., 2006 (full text here) and de Wit et al., 2008 (full text here) --- find that we don't direct our gaze** to the lower face any more often than nonautistic people do. Some other studies have found that we attend to lots of different visual details --- both within the face and outside it --- that neurotypical subjects ignore.

Examples of studies finding a greater degree of attention to "irrelevant" visual details: Pelphrey et al. (full text here) found that the five*** autistic men they studied looked more often at "nonfeature areas of the face", like the hairline, chin, jawline, ear, temples, etc., while the five neurotypical men who served as a control group mostly looked at the triangle-shaped region in the center of the face, encompassing the eyes, nose and mouth. More recently, de Wit et al. also found this to be the case: their autistic subjects spent less time than controls did looking at either the eyes or the mouth --- about half of all their viewing was directed at areas of the face other than eyes, nose or mouth. Also, Dalton et al. found that, while the autistic young men they studied did not focus particularly on the mouth, or on any other particular feature, they definitely avoided the eyes.

Since Dalton et al. were monitoring brain activity along with gaze direction, they noticed intense activity in the amygdalae and orbitofrontal cortices of the autistic subjects whenever they focused on the eyes of the faces they were supposed to be looking at. This effect was totally absent in the nonautistic subjects, which led the authors to consider the possibility that maybe autistic people shy away from meeting people's eyes to spare themselves this nerve-wracking emotional stress:
Notably, the autistic group showed greater activation in the left amygdala and orbitofrontal gyrus than did the control group in response to the standardized emotional facial photographs, and greater right amygdala activation in response to the familiar and unfamiliar facial photographs. These are the areas associated with emotional processes, and these results suggest that processing of faces is associated with a heightened activation in affective central circuitry in autism. Together, these findings suggest that the increased activation in subjects with autism in the orbitofrontal cortex occurs specifically in response to the emotional content of the faces and not to faces in general, whereas activation in the amygdala is not specific to the emotional content of the faces but [is] a response to faces in general.

These findings indicate that the commonly reported hypoactivation in the fusiform gyrus during face processing in autism may be a function of how individuals with autism scan the face rather than a group difference in which area of the brain is used to process faces. ...
...
On the basis of these findings, we suggest that within the autistic group, eye fixation is associated with negatively valenced overarousal mediated by activation in limbic regions such as the amygdala. We propose that diminished gaze fixation within the autistic group may facilitate reduction of overarousal to social stimuli. According to this model, face-processing deficits in autism arise from hyperactivation in the central circuitry of emotion that produces hypersensitivity to social stimuli, leading to characteristic diminished gaze fixation, which in turn results in atypical activation of the fusiform gyrus. Additional studies including those involving direct measures of arousal (both self-reported and physiological) are warranted to further test this model.
This hypothesis --- that autistic people are actually hypersensitive, rather than oblivious, to the emotional content of faces, especially in the eyes --- gets some additional support from de Wit et al.'s main finding. They showed a group of autistic children and a group of typically developing children four photographs of faces --- two with "positive" emotional expressions (a calm face and a smiling face) and two with "negative" ones (a frightened face and an angry face) --- while tracking where the children directed their gaze. They found that both groups looked more at the eyes of the "negative" faces, which seems to me an indication that the autistic children were able to detect, and attend to, the socially threatening messages encoded in the angry and fearful faces. (However, the hyperarousal hypothesis does have some contradictory evidence in the findings of Pierce et al., 2004 --- they found no significant differences in amygdalar activity between autistic and nonautistic people looking at faces).

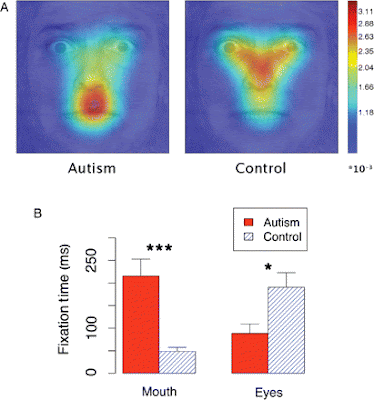
This 2006 article by Dirk Neumann, Michael Spezio, Joseph Piven and Ralph Adolphs, published in Social Cognitive and Affective Neuroscience (and not cited by Jemel, Mottron and Dawson), might help shed some light on the issue of whether or not, and in what contexts, autistic people rely on "looking you in the mouth" to decipher socially salient information: they found no differences whatsoever between their autistic and nonautistic subjects' gaze direction and accuracy at face-reading, except when they asked them to interpret images of faces that had been digitally obscured, making the task of identifying the emotion pictured very difficult.
We asked high-functioning subjects with autism to identify emotional facial expressions, a task people with autism often perform normally. In line with previous findings, we also observed normal accuracy and normal face gaze, provided that whole upright faces were used as the stimuli. When the difficulty of the task was increased and only sparse regions of a face were revealed using the bubbles technique, we still observed normal performance levels in the autism group. However, their gaze onto these sparse facial features became dramatically abnormal. People with autism looked more often and longer (autism, 27.3%; control, 8.7% of all saccades) at the mouth.
In other words, we can interpret faces one of two ways, one of which we are as good at using as nonautistic people are (i.e., the normal way, looking primarily at the eyes) and the other of which works even better, and seems to be autism-specific (i.e., looking primarily at the mouth). The study participants seemed to use the typical, eye-centered face-processing strategy as their default method, switching to the other only when the task became much more difficult, and the image from which they were to extract meaning very poorly visible.

(Fig. 4 from Neumann et al., 2006. Top image is of areas of gaze fixation for the "bubbled" images; bottom image is a graph of how much time autistic vs. nonautistic subjects spent looking at eyes vs. mouth on "bubbled" faces)

Here's what Neumann et al. have to say about their findings:

Our results are consistent with earlier findings that autism subjects are impaired when judging complex social information from the eyes, but not from the mouth (Baron-Cohen, 1995), and that they rely more on information from the mouth for emotional judgments (Spezio et al., 2006). The differences in attentional processing suggest a possible general mechanism for the neurodevelopmental progression of impaired face gaze in autism (Dawson et al., 2005). We failed to observe a deficit in using low-level visual saliency cues, or bottom-up attention, while we found differences in top-down modulation for saccades made to the mouth. We propose that this evidence is consistent with a neurodevelopmental progression that begins in infancy with a failure in directing attention to the faces and more specifically to the eyes in a face, along with preservation of bottom-up attentional processing. This is consistent with the major deficits in social engagement rather than in nonsocial areas when autism is evident in early infancy (Kanner, 1943). Reported signs of lower social engagement in infants with autism include less interest in people (Volkmar et al., 2005) and less looking at faces (Osterling et al., 2002). The abnormal top-down attentional processing of faces may be due to abnormal reward circuitry (Dawson et al., 2005) or to abnormal circuitry for emotional salience (Schultz, 2005). Over the course of development, via learning, top-down attention may cause the propensity for mouth gaze in autism. This hypothesized mechanism adds to previous hypotheses about the causes of deficits in top-down attention to the face, and draws on our findings that bottom-up attention to the face is normal in high-functioning people with autism.

Another possibility is that the bubbles stimuli reveal an impairment in how attention is directed to local vs. global features. In contrast to earlier reports, we observed a normal eye gaze to whole faces. This could also be due to a social training program most of our autism subjects participated in. Despite their overall normal gaze to whole faces, the sparse bubbles stimuli might reveal an underlying impairment in deploying attention to local (vs. global) features (Dakin and Frith, 2005).

Whatever the reasons may be for using one or another, it is certainly clear from these studies that autistic people have a wider range of face-perception strategies, the neuroanatomical correlates are unclear. So it seems to me that, unless a gaze-tracking apparatus is also used, and brain activity correlated to the part of the stimulus actually being viewed, as in Dalton et al. (2005), researchers hoping to pin down the neurophysiological underpinnings of autistic facial perception have no way of knowing that their experimental and control groups are actually doing the same task.

*Some of us are indeed "face-blind," or prosopagnosic. Prosopagnosia is not only seen in autistic people, though; it's a totally different phenomenon.

**You might be wondering how researchers can tell where their subjects are looking. There are several methods, but all the ones used in these studies seem to rely on some sort of head-mounted camera recording the infrared light that reflects off of a subject's corneas.

***The n for many of these studies is very small. I mentioned that for Pelphrey et al. (2002), n = 5; while that is the smallest sample size of any study I cite, most of the others aren't a whole lot bigger. Klin et al. (2002) have 15 autistic and 15 control subjects; Joseph and Tanaka have ~60 typically developing children and ~40 autistic ones; Neumann et al. have ten autistic subjects and ten NT ones; for van der Geest et al., the numbers are 16 autistic and 14 NT; Dalton et al. did two separate experiments, one involving eleven autistic subjects and twelve NT ones, the other involving 16 autistic subjects and 14 controls; Lahaie et al. have 16 autistic and 16 control subjects; and Bar-Haim et al. have twelve autistic and twelve typically developing subjects.

Dalton KM, Nacewicz BM, Johnstone T, Schaefer HS, Gernsbacher MA, Goldsmith HH, Alexander AL, & Davidson RJ (2005). Gaze fixation and the neural circuitry of face processing in autism. Nature neuroscience, 8 (4), 519-26 PMID: 15750588

Jemel, B., Mottron, L., & Dawson, M. (2006). Impaired Face Processing in Autism: Fact or Artifact? Journal of Autism and Developmental Disorders, 36 (1), 91-106 DOI: 10.1007/s10803-005-0050-5

Neumann D, Spezio ML, Piven J, & Adolphs R (2006). Looking you in the mouth: abnormal gaze in autism resulting from impaired top-down modulation of visual attention. Social cognitive and affective neuroscience, 1 (3), 194-202 PMID: 18985106

Pelphrey KA, Sasson NJ, Reznick JS, Paul G, Goldman BD, & Piven J (2002). Visual scanning of faces in autism. Journal of autism and developmental disorders, 32 (4), 249-61 PMID: 12199131

Friday, July 17, 2009

Weak Signals, Lots of Noise: Problems with fMRI Brain Scanning

EXECUTIVE SUMMARY: On noticing a trend in recently published research articles in social neuroscience for correlations between brain activity (observed in fMRI) and whatever behavioral or psychological variable was being looked at to be impossibly high, a group of researchers surveyed the authors of fifty-five recent fMRI studies, asking them how they chose the data points they included in their statistical analyses. Many used anatomical criteria: if their hypothesis dictated that a specific part of the brain should be active under certain conditions, they confined their analysis to those fMRI data points corresponding to where that specific brain structure would be. But most of the study's respondents said they used "functional" criteria, meaning, if it activates under the conditions they're testing, they include it in their results. This is a problem because it guarantees positive results, overselecting for data points that fit the pattern being looked for while screening out those that don't fit it.
______________________________________________

ResearchBlogging.orgOn NPR last week, I heard about an interesting pair of articles published in May dealing with the limitations of fMRI studies in brain research.

This type of brain imaging is widely used in neuroscience, and autism research is no exception. The past decade or so has brought us lots of different hypotheses about how autistic brains work: probably the most extensively studied one I can think of is the observation that, when they're shown images of human faces, autistic people tend to activate a different part of their brains* than non-autistic people do. Functional MRI studies have also yielded a jumble of tentative observations about differences between autistic and neurotypical brain anatomy: this or that structure appears bigger or smaller on average in this or that series of brain scans.

What the authors of the second of the two studies (full text here) I linked in my first paragraph --- Edward Vul, Christine Harris, Piotr Winkielman**, and Harold Pashler --- noticed about many fMRI studies of emotion, personality and social cognition was the phenomenally high correlations between activity observed in a certain brain region in response to a given stimulus (say, images of happy, angry or frightened faces, or recordings of angry speech, or a semi-scripted interaction meant to make the subject feel lonely or rejected) and individual personality traits (empathy, say, or extraversion or anxiety).

They noticed that the correlations reported in many of these studies --- often above 0.8, on a scale of 0 to 1 --- were higher than they could be given the reliability of the tools used to measure each variable:

This, then, is the puzzle. Measures of personality and emotion evidently do not often have reliabilities greater than .8. Neuroimaging measures seem typically to be reliable at .7 or less. If we assume that a neuroimaging study is performed in a case where the underlying correlation between activation in the brain area and the individual difference measure (i.e., the correlation that would be observed if there were no measurement error) is perfect, then the highest expected correlation would be √(.8 x .7), or .74. Surprisingly, correlations exceeding this upper bound are often reported in recent fMRI studies on emotion, personality, and social cognition.
To solve this mystery, Vul et al. surveyed the authors of fifty-five recent social-neuroscience articles describing fMRI studies, asking them exactly how they settled on which values to use (out of the tens or hundreds of thousands of individual data points, or "voxels," making up each image!) in their calculations.

In the articles we are focusing on here, the final result, as we have seen, was always a correlation value --- a correlation between each person's score on some behavioral measure and some summary statistic of their brain activation. The latter summary statistic reflects the activation or activation contrast within a certain set of voxels. ... [V]oxels may be selected based on anatomical criteria [i.e., those roughly corresponding to the targeted brain structure in spatial terms], functional criteria [i.e., those determined to show activity in response to relevant but not irrelevant stimuli], or both. Within those broad options, there are a number of additional more fine-grained choices. It is hardly surprising, then, that brief method sections rarely suffice to describe how the analyses were done in adequare detail to really understand what choices were being made.
...
In our survey, we first inquired whether the fMRI signal measure that was correlated across subjects with a behavioral measure represented the average of some number of voxels or the activity from just one voxel that was deemed most informative (referred to as the peak voxel).

If it was the average of some number of voxels, we asked whether the voxels were selected on the basis of anatomy, or activation seen in those voxels, or both. If activation was used to select voxels, or if one voxel was determined to be most informative based on its activation, we asked what measure of activation was used. Was it the difference in activation between two task conditions computed on individual subjects, or was it a measure of how this task contrast correlated with the individual difference measure? Finally, if functional data were used to select the voxels, we asked if the same functional data were used to compute the reported correlation.
While there was a lot of diversity in the approaches respondents employed, and the distribution across the different approaches was fairly even, there was one fairly important trend that emerged.

First, to lead into what this trend was, I'd like to point out the two places where the distribution was not even: when the average of a group of voxels was used, those voxels were much more often selected using functional criteria than not --- i.e., the functional-only and mixed functional-anatomical approaches accounted for more than three-quarters of the articles (23 of 30, as opposed to only 7 studies using only anatomical criteria) --- and every study that used functional criteria to identify voxels of interest then re-used the same data they had used to select the voxels as their output measure for correlating with the behavioral data.

If your Circular-Reasoning Alarm is starting to sound, you're not alone:

The key [to explaining the "implausibly high" correlations often reported in fMRI studies] ... lies in the 53% of respondents who said that "regression across subjects" was the functional constraint used to select voxels, indicating that voxels were selected because they correlated highly with the behavioral measure of interest.

Figure 3 shows very concretely the sequence of steps that these respondents reported following when analyzing their data. A separate correlation across subjects was performed for each voxel within a specific brain region. Each correlation relates some measure of brain activity in that voxel (which might be a difference between responses in two tasks or in two conditions) with the behavioral measure for that individual. Thus, the number of correlations computed was equal to the number of voxels, meaning that thousands of correlations were computed in some cases. At the next stage, researchers selected the set of voxels for which this correlation exceeded a certain threshold, and reported the correlation within this set of voxels.
In other words, because the pool of available data points is so vast, patterns will crop up wherever you choose to look for them. This is what the study's authors term "non-independence error": using the same functional measures for data analysis that you've already used to select your data set.


This graph shows all the studies Vul et al. reviewed --- you can see, the values of the correlations each study unearthed range from about 0.25 to 1.0. The red squares represent correlations derived using non-independent analyses, and the green ones represent independent analyses. You can see that the red ones tend to have much higher values than the green ones --- most of the green ones are clustered between 0.5 and 0.65, which are well below the "upper bound" of 0.74 cited earlier.

Further reading: Mind Hacks, the Neurocritic, and the Neuroskeptic have all posted on this a while ago; also worth reading are these two posts by Andrew Gelman at Statistical Modeling, Causal Inference, and Social Science, this post at The Amazing World of Psychiatry, and two articles in response to Vul et al., one also published in Perspectives on Psychological Science and the other posted online as a draft.

*This would be the "fusiform face area," the existence of which was proposed in 1997 by Nancy Kanwisher and her colleagues. Kanwisher, interestingly enough, seems to be working with Ed Vul --- she co-wrote this longer article about non-independence error with him. Sadly, none of the articles Vul et al. evaluated dealt with the fusiform gyrus, face recognition, or autism, so I can't draw any conclusions about the robustness of that theory. Nor can I (right now, anyway) apply this article's findings more directly to the neuroscience of autism.

**Autism researcher!


Vul, E., Harris, C., Winkielman, P., & Pashler, H. (2009). Puzzlingly High Correlations in fMRI Studies of Emotion, Personality, and Social Cognition Perspectives on Psychological Science, 4 (3), 274-290 DOI: 10.1111/j.1745-6924.2009.01125.x